The surface
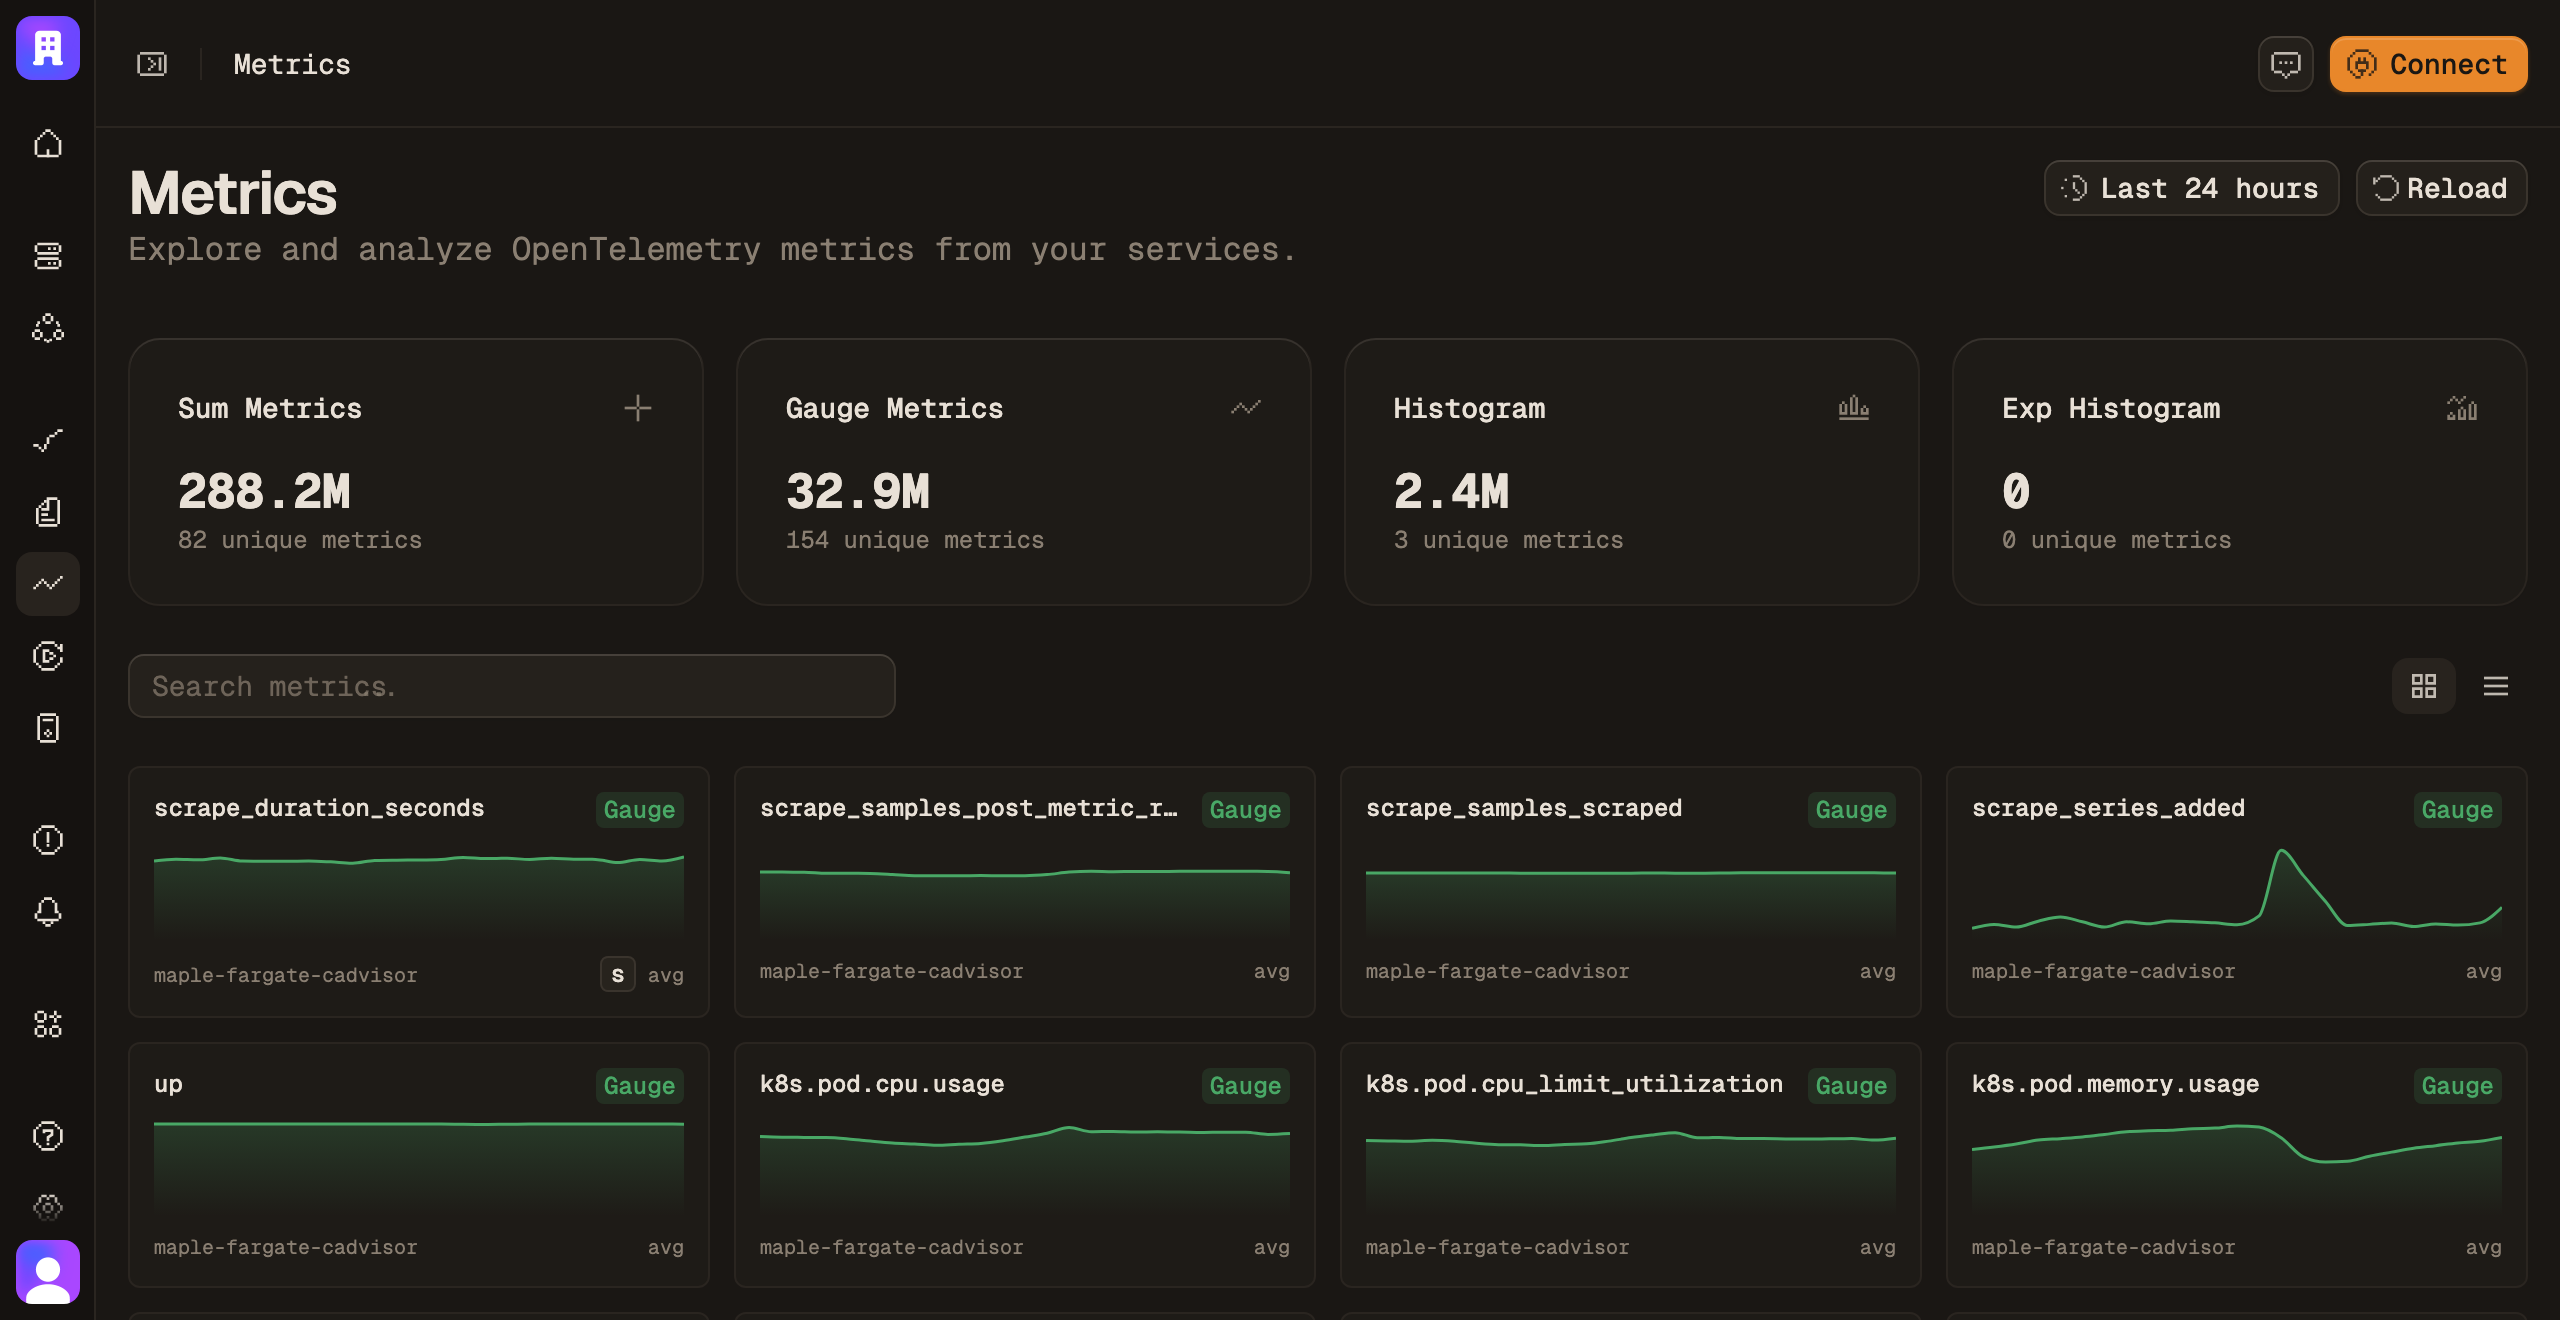
Every metric, with its type and its cardinality
The explorer lists what your services actually emit, not what a template expects. Cardinality is shown per metric, because that is the number that decides what a query costs.
/metrics http.server.request.duration
- signal
- metrics
- temporality
- delta · cumulative
- widgets
- series · stat · table · histogram
- percentiles
- p50 · p95 · p99
- variables
- $service · $env